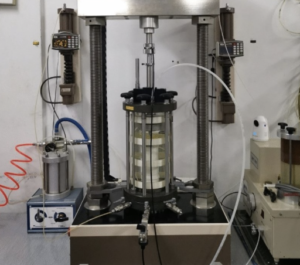
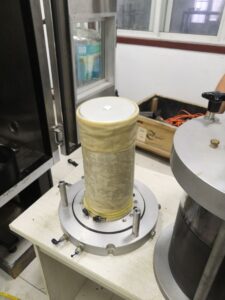
Automation in Triaxial Testing: Integrating Sensors with Data Acquisition Software
Great specimens and a rigid frame won’t rescue bad data. Automation—linking sensors to robust data acquisition (DAQ) software—turns analogue behaviour into synchronised, auditable numbers and runs your test plan with repeatable precision.
How Do Sensors Integrate with Data Acquisition Software?
From sensor to decision, the data path looks like this:
-
Sensors (analogue signals)
- Load (strain-gauge load cell, mV/V)
- Displacement (LVDT/encoder)
- Pressures (pore water, cell, back pressure—piezoresistive transducers)
- Volume change (flow pump encoder / burette LVDT)
- Temperature (RTD/thermistor)
-
Signal conditioning
- Bridge completion & stable excitation1 (2.5–10 V), low-noise amplification, anti-alias filtering, temperature compensation.
-
A/D conversion & timing
- 16–24-bit ADCs2, shared clock; typical sampling 1–50 Hz for monotonic CU/CD (higher for cyclic).
- Hardware sync keeps load, displacement, and pressure in phase.
-
Drivers & DAQ software
- Channel templates store calibration factors, units, zero/tare.
- Calculated channels: (q), (p’), (\varepsilon_a), (\varepsilon_v), B-value, secant modulus windows, etc.
- Scripts automate stages: saturation → consolidation → shearing, with safety interlocks and stop conditions.
-
Control loop (optional)
- Software sets strain rate, cell/back pressure setpoints, or pump flow; interlocks halt on over-pressure/over-stroke.
-
Storage & audit
- Auto-save with metadata (operator, calibration ID, firmware version), checksum files, and role-based access—fit for ISO/IEC 17025 workflows.
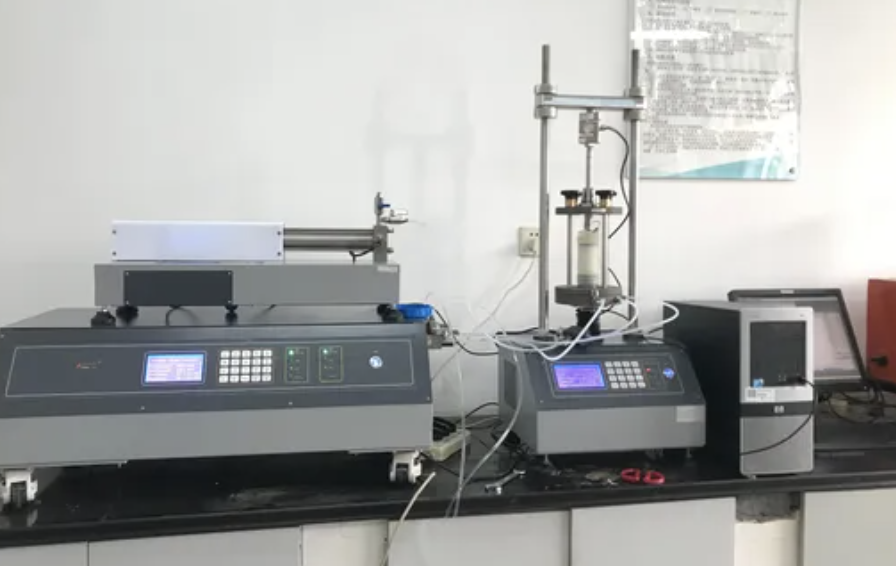
Why Is Automation Important in Triaxial Testing?
- Reproducibility: Same strain rate, same data timing, same stop rules—independent of operator.
- Data integrity3: Buffered logging, tamper-evident files, full traceability for reports and audits (ASTM D4767/D2850, BS 1377 aligned methods).
- Safety: Real-time interlocks on pressure, stroke, load, and leak detection reduce specimen loss and equipment risk.
- Throughput: Auto stage changes and end-conditions free technicians for prep, calibration, and reporting.
- Quality in real time4: Live B-value, effective stress paths, and drift alarms surface issues before the point of no return.
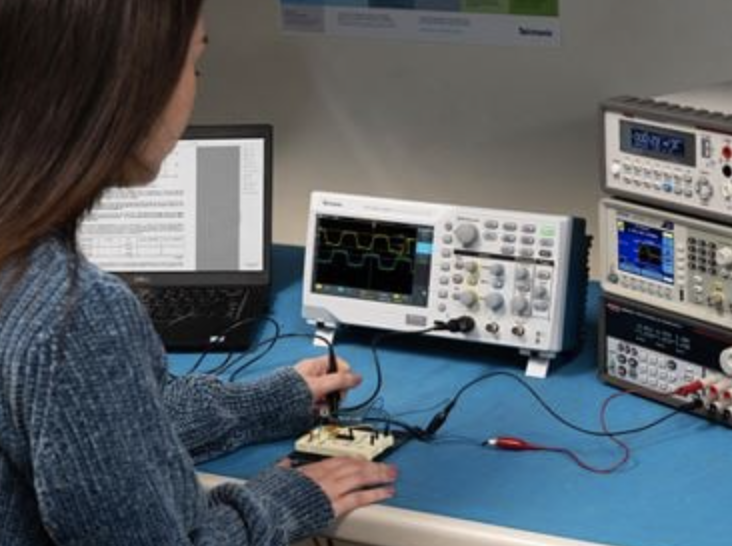
What Parameters Can Be Measured Automatically?
| Parameter | Typical Sensor | Resolution/Accuracy Target | Guideline Sample Rate | Notes |
|---|---|---|---|---|
| Axial load | Strain-gauge load cell | ≤0.25–0.5% FS | 5–20 Hz | Stable excitation reduces drift |
| Axial displacement | LVDT / encoder | 0.5–2 µm | 5–50 Hz | Encoder for cyclic/dynamic |
| Cell pressure | Piezoresistive transducer | ≤0.1–0.25% FS | 2–10 Hz | Temp-compensated |
| Pore water pressure (u) | Piezoresistive transducer | ≤0.1–0.25% FS | 5–20 Hz | Critical for CU tests & B-check |
| Back pressure | Pressure transducer | ≤0.1–0.25% FS | 2–10 Hz | Drives saturation quality |
| Volume change | Flow pump encoder / burette LVDT | ≤0.1–0.2 cm³ | 2–10 Hz | Effective stress & compressibility |
| Temperature | RTD / thermistor | ±0.1–0.2 °C | 0.5–1 Hz | Drift correction/viscosity |
Derived (software-calculated) channels
- Deviator stress (q), mean effective stress (p’), axial & volumetric strains (\varepsilon_a, \varepsilon_v), B-value (Δu/Δσ₃), stiffness windows (E50), and peak/post-peak criteria.
- For strength parameters (e.g., (\varphi’), (c’)), software assists with fitting; results still rely on correct test staging and assumptions.
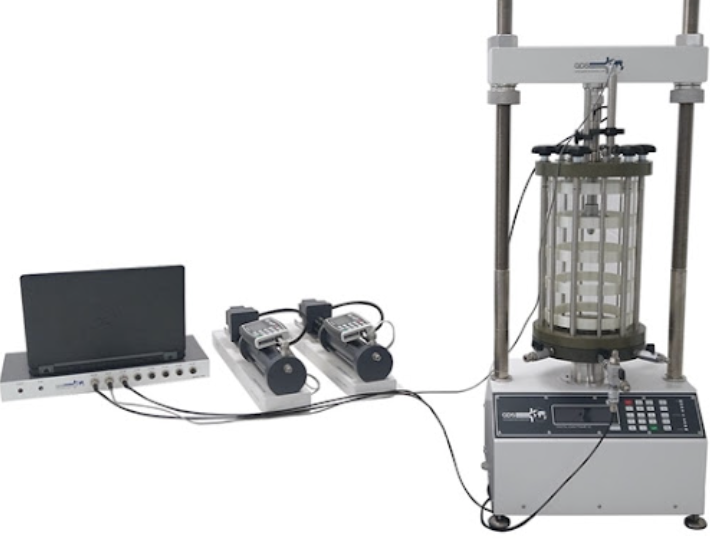
How Do Data Acquisition Systems Improve Lab Efficiency?
1) Faster, cleaner setup
- Auto-discovery of sensors and saved channel templates reduce wiring and scaling mistakes.
- On-screen plumbing checks: live u, cell P, back-pressure trends expose leaks or trapped air early.
2) Automated test logic
- Stage scripts: isotropic consolidation → saturation (live B-value5 target, e.g., ≥0.95) → shearing at constant strain rate.
- Stop conditions6: peak/post-peak %, target strain, u-excess, load drop; automatic unload/hold routines.
3) Real-time QA
- Drift and noise monitors, rate-of-change alarms, and sensor health flags (excitation fault, saturation plateau).
- Calculated channels drive dashboards for q–ε, p′–q, and pore-pressure response without manual spreadsheets.
4) Reporting & LIMS
- Barcode/QR specimen IDs, template-based reports (CSV/PDF), auto export to LIMS; versioned method files support audits.
- Batch views highlight outliers by water content, density, or consolidation state—before you waste another specimen.
Selection Checklist (Sensors + DAQ + Software)
- ADC & noise: 16–24-bit, low rms noise, proper anti-alias filters.
- Timing: Single time base across channels (no PC-clock drift).
- Excitation stability for mV/V bridges; shielded, grounded wiring (star ground; avoid loops).
- Environmental robustness7: Temperature compensation; strain-relieved connectors.
- Software fit: Real-time plots, calculated channels, scripting, auto-save8, user roles, and event logs.
- Calibration: Multi-point routines, certificate storage, due-date prompts, uncertainty notes.
- Standards awareness: Built-in templates aligned with common triaxial standards (ASTM/BS).
Good Lab Practice (quick wins)
- Warm up electronics 10–20 min; zero channels with test valves in their actual positions.
- Verify linearity & hysteresis at 3–5 points, not just a single span.
- Cross-check pore-pressure transducers with a dead-weight tester periodically.
- Document uncertainty (sensor, DAQ, temperature, alignment) in the method record.
Conclusion
Automation links trustworthy sensors to disciplined software: stable conditioning + high-resolution conversion + synchronised timing + scripted control. The reward is immediate—faster saturation, cleaner effective-stress paths, safer interlocks, higher B-values, and reports that withstand scrutiny. That’s how modern labs turn triaxial testing into a repeatable, auditable production process.
-
Understanding stable excitation is crucial for effective signal conditioning, ensuring accurate sensor readings. ↩
-
Exploring 16–24-bit ADCs will enhance your knowledge of high-resolution data conversion, vital for precise measurements. ↩
-
Explore this link to understand how to maintain data integrity, crucial for accurate testing and reliable results. ↩
-
Discover how real-time quality monitoring can enhance testing efficiency and prevent costly errors. ↩
-
Understanding B-value is crucial for optimizing test conditions and ensuring accurate results in automated testing. ↩
-
Exploring stop conditions can enhance your testing strategies and improve the reliability of your automated tests. ↩
-
Learn about the significance of environmental robustness in ensuring reliable performance of data acquisition systems. ↩
-
Explore how auto-save features enhance data integrity and user experience in data acquisition systems. ↩

