The Role of Sensor Data Acquisition Systems in Soil Triaxial Testing
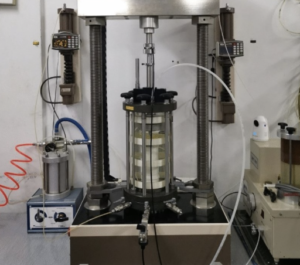
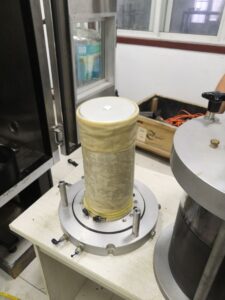
In a triaxial test, great specimens and sturdy frames still won’t save bad data. Sensor data acquisition systems (DAQs) turn analogue behaviour—load, pressure, volume change—into trustworthy numbers, timestamped and synchronised. That’s the difference between a nice stress–strain curve and a defensible engineering decision.
How Do Sensor Data Acquisition Systems Work in Triaxial Testing?
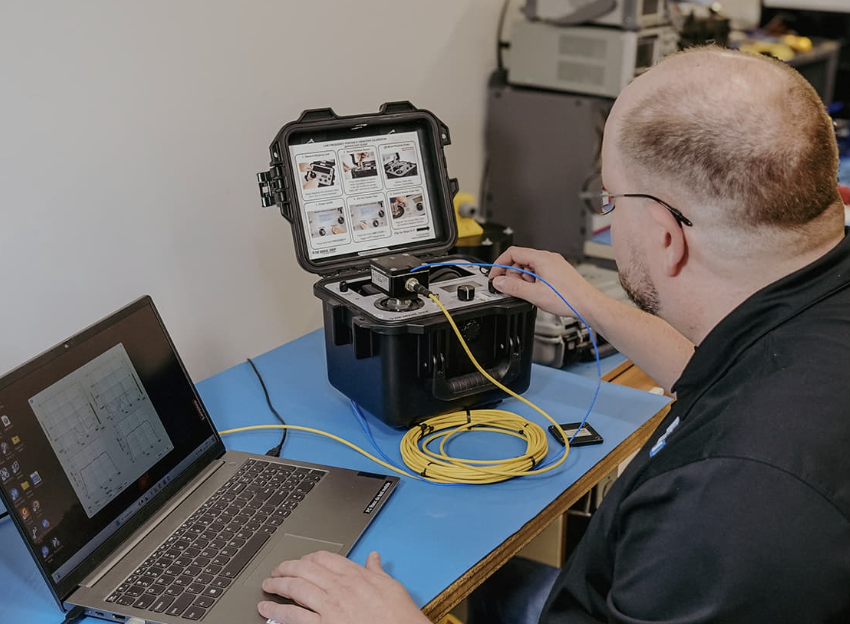
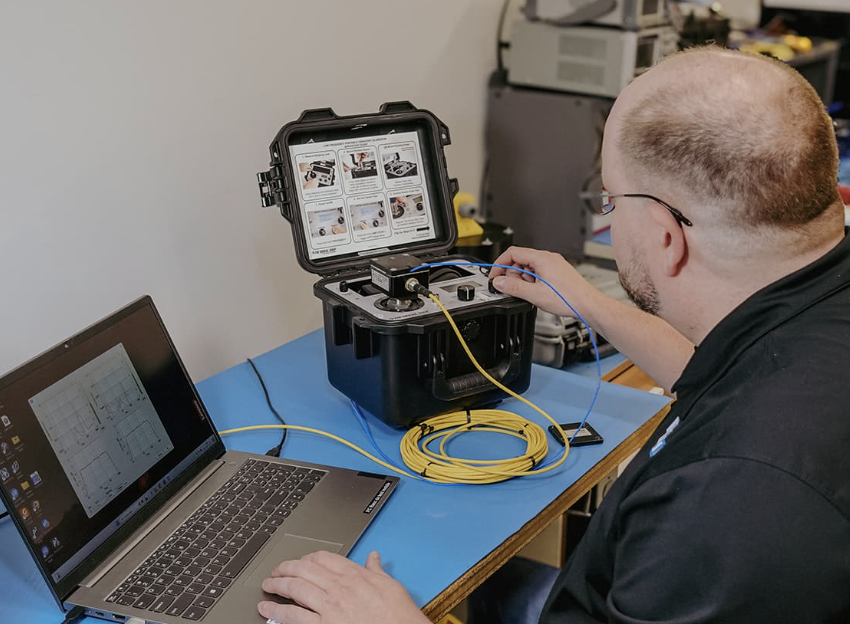
A triaxial DAQ sits between sensors and control software, providing excitation, signal conditioning, conversion, and time-synchronisation.
Core chain
- Sensors generate analogue signals
- Strain-gauge load cells (mV/V), LVDTs/encoders, piezoresistive pressure transducers, thermistors, flow/volume devices.
- Signal conditioning1
- Wheatstone bridge completion, stable excitation (2.5–10 V), low-noise amplifiers, anti-alias filters, cold-junction compensation (if needed).
- A/D conversion
- Time base & sync
- A common clock tags each channel so axial load, pore pressure, and displacement are in phase.
- Comms & logging
- Buffered transfer (USB/Ethernet) to software for display, closed-loop control, and file storage with audit metadata.
Why this architecture matters
- Stable excitation + low noise = less drift.
- Proper filtering = smooth signals without lag.
- Shared clock = accurate q–p, ε–q, and B-value calculations.
Why Are Sensor Data Acquisition Systems Important for Soil Testing?
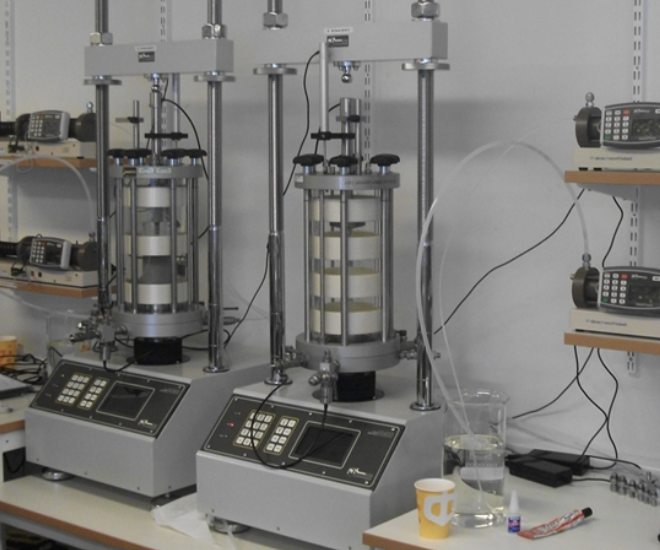
- Traceable accuracy — Calibration factors, uncertainty budgets, and date-stamped files make results align with lab systems like ISO/IEC 170253 and test standards (e.g., ASTM D4767/D2850, BS 1377).
- Data integrity4 — Buffered writes, checksum files, user roles, and tamper-evident logs protect critical results.
- Real-time decisions — Live B-value, effective stress, strain rate, and failure criteria enable controlled shearing and safe shut-downs.
- Reproducibility — Consistent sampling and synchronised channels reduce operator variability and re-tests.
In short: the DAQ converts good practice into defensible numbers—repeatable, auditable, and usable in design.
What Parameters Can Be Monitored with Sensor Data Systems?
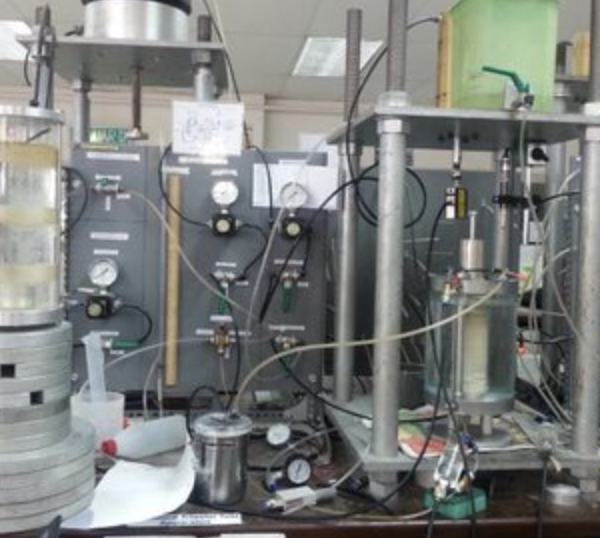
| Parameter | Typical Sensor | Typical Range | Resolution/Accuracy Target | Sample Rate (guideline) | Notes |
|---|---|---|---|---|---|
| Axial load / deviator stress | Strain-gauge load cell | 0–10/50 kN | ≤0.25–0.5% FS | 5–20 Hz | Stable excitation reduces drift |
| Axial displacement / strain | LVDT or encoder | 0–25/50 mm | 0.5–2 µm | 5–50 Hz | Encoder for cyclic/dynamic |
| Confining (cell) pressure | Piezoresistive transducer | 0–2/3 MPa | ≤0.1–0.25% FS | 2–10 Hz | Temperature compensated |
| Pore water pressure (u) | Piezoresistive transducer | 0–2 MPa | ≤0.1–0.25% FS | 5–20 Hz | Critical for CU tests & B-check |
| Volume change | Flow pump encoder / burette LVDT | ±50/100 cm³ | ≤0.1–0.2 cm³ | 2–10 Hz | Back-pressure systems common |
| Back pressure | Pressure transducer | 0–1 MPa | ≤0.1–0.25% FS | 2–10 Hz | Affects saturation quality |
| Temperature | RTD/thermistor | 0–50 °C | ±0.1–0.2 °C | 0.5–1 Hz | For drift correction/viscosity |
FS = full scale. Choose the narrowest sensible range to maximise effective resolution.
How Do Data Acquisition Systems Improve Lab Efficiency?
1) Faster setup & fewer repeats
- Sensor auto-discovery, stored calibration factors, and channel templates5 reduce wiring mistakes.
- On-screen plumbing checks (live u, cell P, back-pressure) catch leaks before shearing.
2) Real-time quality control
- Live B-value calculator (Δu/Δσ₃) guides saturation to B ≥ 0.95.
- Strain-rate monitors and safety interlocks prevent over-speed and pressure exceedance.
3) Automated workflows
- Scripted test stages6 (isotropic consolidation → saturation checks → shearing).
- Stop conditions (peak/post-peak %, target axial strain, or u-excess limit) end tests cleanly.
- Automatic calculations: q, p′, εa, εv, secant/Young’s modulus windows, friction angle estimates.
4) LIMS & reporting
- Barcodes for specimens, one-click export (CSV/PDF), and audit trails (who/when/what changed) shorten reporting cycles.
- Batch dashboards reveal outliers early (e.g., unusual stiffness vs. water content).
Practical Selection Checklist (DAQ + sensors)
- Resolution & noise: 16–24-bit ADC, low rms noise, proper anti-alias7 filters.
- Sync: Single time base for all channels.
- Isolation & grounding: Analogue isolation and star-ground; avoid ground loops.
- Excitation stability: Low drift for strain-gauge bridges (mV/V sensors).
- Environmental robustness: Temperature compensation and shielded cables.
- Software fit: Real-time plots, scripting, calculated channels (q, p′, B), user roles, and auto-save8.
- Calibration support: Multi-point routines, certificate storage, due-date prompts.
- Standards aware: Templates aligned with ASTM D4767/D2850 and BS 1377 practices.
Good Lab Practices (GLP) for Reliable Triaxial Data
- Warm-up electronics (10–20 min) before zeroing.
- Zero all channels under test plumbing state (valves as used).
- Verify linearity and hysteresis at 3–5 points, not just a single span.
- Periodically cross-check pore-pressure transducers against a dead-weight tester.
- Document uncertainty contributions (sensor, DAQ, temperature, alignment) in your method.
Conclusion
Sensors measure; DAQ systems make measurements usable—accurate, synchronised, and auditable. Choose stable conditioning, high-resolution conversion, and software that understands triaxial stages. The payoff is immediate: faster saturation, cleaner effective stress paths, higher B-values, and repeatable results your clients (and your QA manager) can trust.
-
Understanding signal conditioning is crucial for optimizing sensor performance and ensuring accurate data acquisition. ↩
-
Exploring the advantages of 16–24-bit ADCs can enhance your knowledge of high-resolution data conversion and its applications. ↩
-
Understanding ISO/IEC 17025 is crucial for ensuring laboratory quality and compliance, making this resource invaluable for professionals. ↩
-
Exploring data integrity practices helps safeguard critical results, ensuring reliability and trust in laboratory data. ↩
-
Understanding channel templates can help you reduce wiring mistakes and improve setup efficiency. ↩
-
Exploring scripted test stages can enhance your knowledge of automated workflows and streamline testing processes. ↩
-
Understanding anti-aliasing is crucial for improving signal quality and avoiding distortion in data acquisition. ↩
-
Exploring auto-save features can enhance your understanding of data protection and user experience in software. ↩

