The Role of Soil Testing in Precision Agriculture: Turning Data into Productivity
I treat soil tests like a GPS for decisions. They show what to fix first, where to invest more (or less), and how to prove it paid off.
From Field Variability to Actionable Maps
Fields aren’t uniform. Slopes, soil types, past management, and drainage create zones1 that behave differently. Precision ag2 is simply: measure the differences → map them → manage them differently.
Data layers I stack (simple > fancy):
- Soil test (pH, EC, nutrients, OM) — chemistry & capacity
- Soil texture/CEC/EC mapping — holding power & salinity risk
- Elevation & slope — water movement & erosion risk
- Yield maps (past seasons) — where the field already tells you a story
- Remote sensing (NDVI/biomass) — in-season crop response
Action rule: If two layers agree (e.g., low K + low yield), that zone earns priority. If layers disagree, verify with a targeted resample.
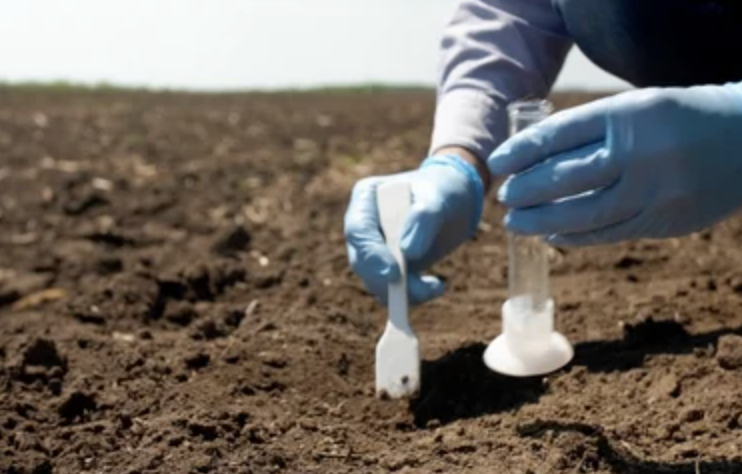
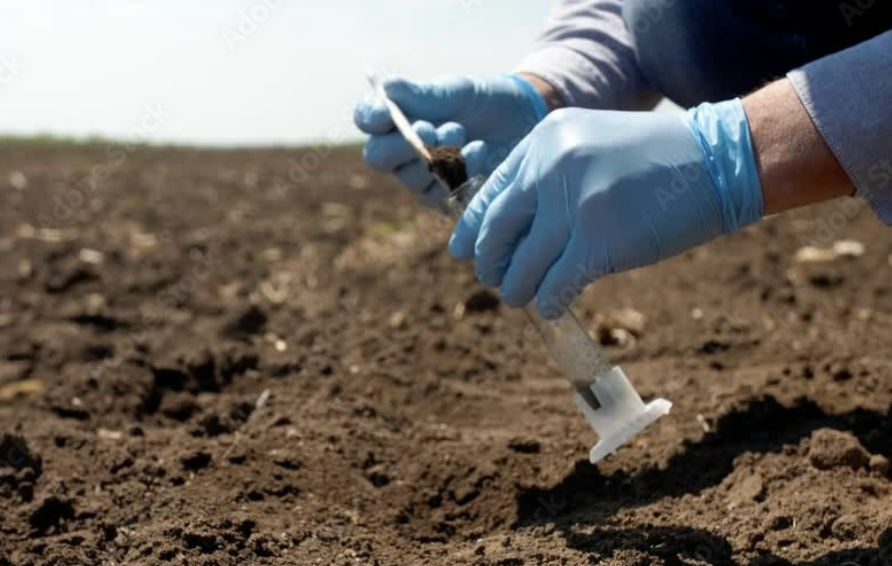
Sampling to Insights: A Repeatable Workflow
Consistency beats complexity. Here’s the workflow that keeps my maps honest year after year.
-
Draw zones
Start with yield + elevation + prior soil maps. Split into 3–6 zones that make agronomic sense. -
Sample smart
- Composite 10–15 cores/zone (6–8” depth for most row crops; follow local guides).
- Clean probe, label well, avoid headlands/odd spots.
- Keep timing consistent (same growth stage/season each cycle).
-
Choose tests
- Core panel: pH, buffer pH, EC, OM, P, K, S, Ca, Mg, Zn, B (as needed).
- Consider CEC, texture, and SAR/ESP where salinity/sodicity is suspected.
-
QA the lab sheet
- Check units and extractants match your local recs.
- Re-run any “wild” outliers with a fresh sub-sample.
-
Map it
Import results to your FMIS/GIS and symbolize Low / Adequate / High per the regional guidelines. Don’t overfit—zones first, fancy math later. -
Write prescriptions
Variable-rate lime/gypsum/P/K first. Nitrogen stays split & adaptive (soil + weather + crop model). -
Execute & log
Calibrate spreaders/planters; save a copy of the as-applied file. What you planned is not always what the machine did.
Translating Numbers into Decisions
Turn rows of numbers into this-season actions and long-term moves.
Chemistry (fix first)
- pH: Lime acidic zones based on buffer pH3; in high pH areas, acidify bands/inputs and switch to chelated Fe when needed.
- Salts/Sodicity (EC, SAR/ESP): Improve drainage, apply gypsum for sodic zones, and plan leaching with good water quality.
Fertility (feed with precision)
- Phosphorus (P): Band low zones near the seed/root; broadcast to build when budgets allow.
- Potassium (K): Split on sands/low CEC; broadcast on clays/high CEC.
- Nitrogen (N): Base rate on yield goal + credits; split applications4 with stabilizers where loss risk is high.
- Sulfur & Micros: Low OM or coarse soils often need S; use tissue tests mid-season to confirm micros.
Structure & water (make it last)
- Manage compaction (controlled traffic, shallower passes).
- Use cover crops (mixes with grasses/legumes) to lift OM and improve infiltration.
- Patch drainage issues before throwing more fertilizer at a symptom.
Fast decision matrix
| Finding | In-Season Action | Long-Term Move |
|---|---|---|
| Low pH in two zones | Zone-rate lime; adjust P source | Maintenance lime every 2–3 yrs |
| High EC / high SAR | Gypsum + leaching events | Tile/ditch; salt-tolerant hybrids in worst areas |
| Low P & K | Band P; split K on sands | Slow build with broadcast in off-years |
| Low OM, compaction | Cover crop + reduce till | Compost/manure; controlled traffic |
| High N losses | Split N + inhibitor | Raise OM; smarter irrigation timing |
Measuring ROI and Closing the Loop
If you don’t measure, you’re guessing. I run side-by-side truth strips and track the money.
How I check ROI
- A/B test strips: Keep a fixed-rate strip across the field; compare yield vs. variable-rate zone.
- Margin, not yield alone:
[
\text{ROI} = \frac{(\Delta \text{Yield} \times \text{Price}) – \Delta \text{Input Cost}}{\Delta \text{Input Cost}}
] - Stability matters: Wins in 2 of 3 seasons beat a one-time miracle.
Starter KPI set
| KPI | Why it matters | Target/Note |
|---|---|---|
| pH within crop range | Unlocks nutrients | ≥ 90% of acres in range |
| P & K sufficiency | Yield reliability | Zones “Adequate” or better |
| N use efficiency5 | Profit + environment | Trend up over 3 years |
| OM % | Resilience | +0.2–0.3% per 3–5 yrs |
| $ margin/acre | Real payback | Positive in 2/3 seasons |
Close the loop (every fall or post-harvest)
- Overlay yield6 with as-applied and soil maps.
- Note where responses matched prescriptions (and where they didn’t).
- Adjust next year’s zones & rates—keep what worked, shrink what didn’t.
- Re-test key zones on a 2–3 year cycle; faster in high-change areas (sand, manured ground).
Bottom Line
Precision ag is not about more data—it’s about better timing and placement. Map variability, fix chemistry, feed with precision, and measure the result. Do that, and your inputs work harder, your fields get steadier, and your spreadsheet—finally—shows the story you felt in the cab.
-
Understanding agricultural zones is crucial for effective farming strategies, as they influence crop management and yield. ↩
-
Exploring Precision ag can reveal innovative techniques that enhance productivity and sustainability in agriculture. ↩
-
Understanding buffer pH is crucial for effective soil management and optimizing crop health. ↩
-
Exploring split applications can enhance nutrient efficiency and reduce loss risks in your farming practices. ↩
-
Understanding N use efficiency is crucial for improving profit margins and environmental sustainability in farming. ↩
-
Exploring methods to enhance crop yield can lead to better productivity and profitability for farmers. ↩