I used to focus only on the soil curve. Then I realised the membrane has its own stress–strain story too.
Under confining pressure, a latex membrane stretches, carries hoop tension, and creeps over time. That behaviour can nudge volume change, pore pressure stability, and even the shape of q–ε curves.
Let’s break it down in a way you can actually use.
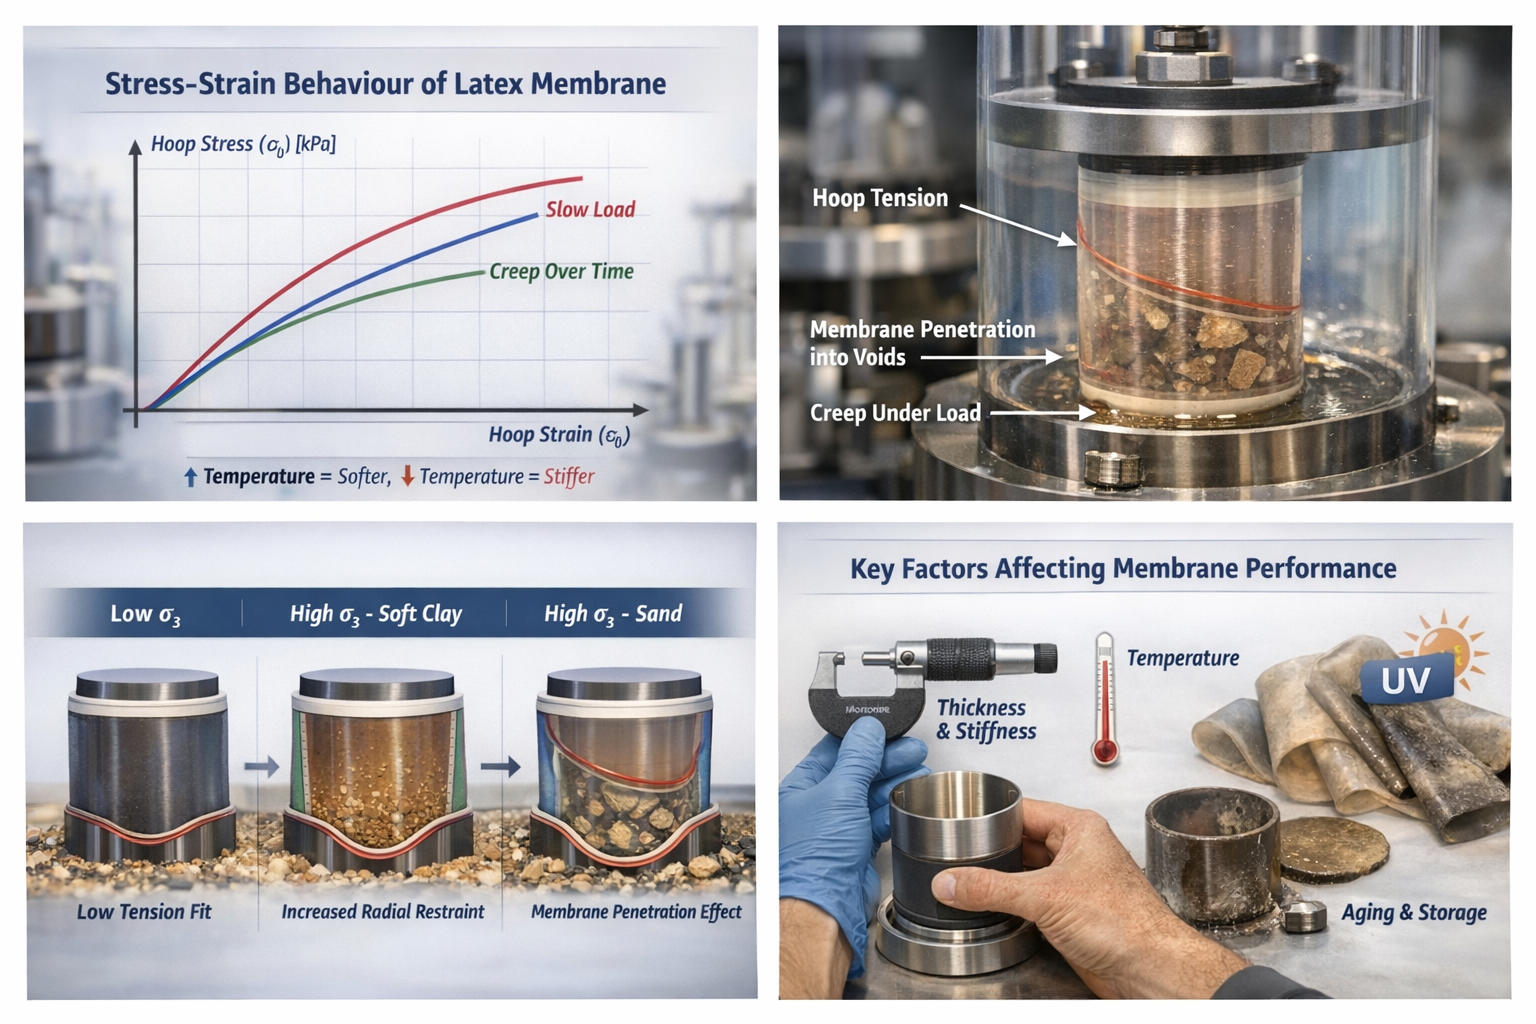
Stress–Strain Behaviour of Latex Membranes Under Confining Pressure
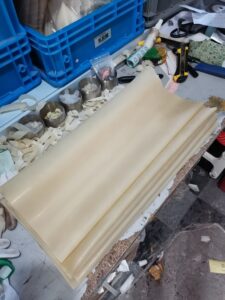
The membrane is basically a thin rubber cylinder being stretched while squeezing the specimen.
As cell pressure rises, latex develops hoop stress and strain; it responds nonlinearly and can creep, meaning the stress–strain relationship changes with time, temperature, and strain rate.

Picture what’s happening inside the cell: the specimen tries to expand or contract, and the membrane is the “skin” that must follow. When confining pressure σ₃ increases, the membrane is pressed against the specimen while also being stretched around it. That stretching creates hoop tension. If latex were perfectly linear, the stress–strain curve would be a neat straight line. But latex is viscoelastic—it behaves like a mix of spring and honey. Pull it fast and it feels stiffer. Hold it under load and it slowly stretches. Warm it up and it gets softer.
So the membrane’s stress–strain curve isn’t one curve. It’s a family of curves depending on:
- how quickly pressure changes,
- how long you hold pressure,
- the lab temperature,
- the wall thickness and material batch.
In long consolidation holds, you may see slow drift in volume controllers even after the soil has “settled.” Sometimes that’s membrane creep plus thermal expansion of the system, not soil compressibility. In sands under high σ₃, you can also see local membrane penetration into voids, which looks like extra compression early in the test.
This is why I like one simple habit: run a short dummy-cylinder pressurisation using the same membrane and plumbing. It tells you how much of the curve is “system.” My note on how to do that quickly is here: dummy baseline method.
| Membrane response | What you may observe | Why it matters |
|---|---|---|
| Nonlinear stretch | Curves shift by rate | Changes apparent stiffness |
| Creep over time | Slow drift during holds | Bias in volume change |
| Temperature sensitivity | Day-night “breathing” | False deformation signals |
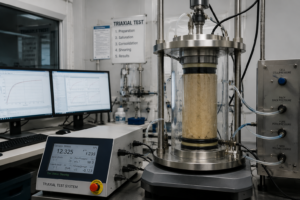
Understanding Stress–Strain Behaviour of Latex Membranes in Triaxial Testing
In triaxial work, membrane behaviour matters because it changes boundary conditions.
Membrane stiffness adds extra radial restraint, influencing radial strain, end friction, and how stress is transmitted to the specimen—especially in CU and CD tests.

When we say “stress–strain behaviour,” we usually mean soil. But the membrane is also under stress and strain, and it’s always in the loop. A stiffer membrane (higher effective stiffness) reduces radial strain. That can slightly increase apparent confinement and make a specimen look stronger or less dilative than it really is. A softer membrane allows more radial freedom, which is better for fidelity—but it demands perfect mounting to avoid wrinkles and micro-leaks.
In UU tests, the main goal is total stress strength and speed. Membrane effects are present, but they often hide under bigger soil behaviour. In CU, membrane behaviour matters more because pore pressure is your key measurement. Small changes in radial restraint can nudge the effective stress path. In CD, it matters because volume change is your headline result, and membrane creep or folds can create fake trends.
I try to keep it practical:
- If I see low B-values or pore-pressure drift, I suspect sealing and membrane seating before blaming saturation time.
- If I see a breathing volume curve in CD, I suspect wrinkles and temperature swings.
- If peak strength changes after a membrane lot change, I check thickness and stiffness consistency.
I keep a small “what to log” list next to the frame: membrane batch, thickness, mounting vacuum, temperature, and hold times. It helps me spot patterns quickly: logging template.
| Test type | Why membrane behaviour matters | Best protection |
|---|---|---|
| UU | Avoid leaks, avoid tears | Medium wall, fast mount |
| CU | u-excess and stress path | Thin–medium, B ≥ 0.95 |
| CD | volume curve accuracy | Thin, wrinkle-free seating |
How Confining Pressure Influences Membrane Deformation and Response
Higher σ₃ magnifies everything: tension, penetration, and creep.
As confining pressure increases, membrane hoop tension rises, penetration into voids increases (in granular soils), and creep becomes more noticeable during long holds—impacting volume and stress interpretation.

At low confining pressures, the membrane mostly behaves like a quiet wrapper. At high σ₃, it becomes an active mechanical part. The membrane is pressed harder into the specimen surface, and its hoop tension rises. With sands, that pressure pushes latex into small voids between grains—this is the membrane penetration effect. It can make the system look like it is compressing more than the soil skeleton actually is. In a volume controller, this shows up as extra early “compression,” especially when you step σ₃ up.
Meanwhile, higher σ₃ also means more sustained stress on the latex. In long-duration stages, creep becomes a bigger portion of the observed drift. If your lab temperature changes, the effect is amplified. The tricky part is that these effects can look like real soil time-dependence. That’s why I like a simple sanity check: compare consolidation drift with a dummy baseline at the same σ₃ and temperature window.
Practical implications by soil:
- Soft clays: higher σ₃ + stiff membrane may inflate apparent strength.
- Dense sands: higher σ₃ + penetration may bias volume change and dilation signals.
- Angular grains: higher σ₃ increases pinhole risk—thicker or tougher membrane helps.
If you’re running very high σ₃ programs, I recommend keeping two wall grades on hand and validating the system once per batch: high-σ₃ checklist.
| Increasing σ₃ does this… | Membrane effect | Data risk |
|---|---|---|
| Raises hoop tension | More radial restraint | Apparent strength shift |
| Presses into voids | More penetration | Volume bias |
| Increases sustained load | More creep | Time drift |
Key Factors Affecting Stress–Strain Performance of Latex Membranes
Membrane behaviour is controlled by material, environment, and mounting.
Thickness, Young’s modulus, temperature, strain rate, aging, surface finish, and fit quality determine how latex stretches, creeps, seals, and interacts with the specimen under pressure.

If you want stable membrane behaviour, you don’t need magic—you need control. The biggest factors I watch:
1) Thickness & batch consistency
Thicker walls carry more hoop force and can add restraint. More important than “thin vs thick” is that the wall is consistent across the length and consistent across the lot. Scatter starts when thickness drifts.
2) Young’s modulus (effective stiffness)
Latex stiffness changes with temperature and strain rate. A membrane that seems fine on a warm afternoon may feel tight on a cold morning. This is why temperature logging matters.
3) Mounting quality
Wrinkles and trapped air are the enemies. I use moderate vacuum, release in steps, and re-seat at the first fold. A fold can behave like a micro-reservoir and corrupt volume readings.
4) Aging and storage
Heat, UV, and ozone degrade latex. I store membranes sealed, cool, and dark, and rotate stock. Old membranes tear easily and creep more unpredictably.
5) Soil surface conditions
Angular sands and rough stones increase pinhole risk. Cleaning stones and using the right wall thickness can prevent repeat failures.
I keep this small decision sheet for choosing wall and fit quickly: membrane selection guide. If your lab wants more reliability, I recommend building a simple “mounting SOP + baseline test” routine. It’s boring—but it works.
| Factor | If uncontrolled… | What I do |
|---|---|---|
| Temperature swings | Breathing curves | Log + stabilise room |
| Wrinkles | Fake dilation | Re-seat early |
| Rough hardware | End tears | Weekly deburr |
| Aging stock | Random failures | FIFO storage |
Conclusion
Latex membranes have their own stress–strain life under σ₃—control fit, temperature, and batch consistency, and your triaxial data stays trustworthy.